Independent public health consultant Kevin Duffy looks at the driving factors behind the low number of babies born in the UK.
It has recently become clear that the UK’s birth rate is in decline, raising concerns about future economic, social, and political impact. There are many factors driving this trend, the whys, that other posts will address; the following addresses the ‘how’, concluding that we are facing a UK birthed baby shortage that is driven by abortion.
In mid-August, the Office for National Statistics, ONS, released its latest data about the number of births in England and Wales. News media and commentators were quick to headline the fact that live-births in 2022 were the lowest since 2002, itself the lowest since the mid-1970s, as shown in the graph below.
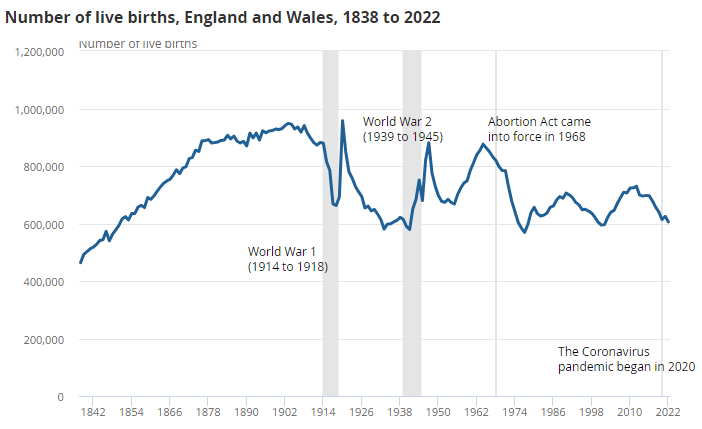
Figure 1: Source: Births in England and Wales from the Office for National Statistics.
Some have labelled this as Britain’s baby bust, linking it to the current cost-of-living crisis; some have welcomed the news, stating boldly that a UK birth slump is good news for the planet. There are of course many reasons why women and their partners are choosing to delay starting a family and having fewer children overall, and it does seem that worries about finances and climate change are having an impact. However, the falling birth rate is not just a recent trend and whilst the ‘why’ might be changing, the ‘how’ has been with us for many decades.
The fact that the UK’s annual number of live births has been in long-term decline may not have been noticed given the tendency to focus on our growing population. UK population in 1972 was 56 million and fifty years later it has increased by 20% to more than 67 million.
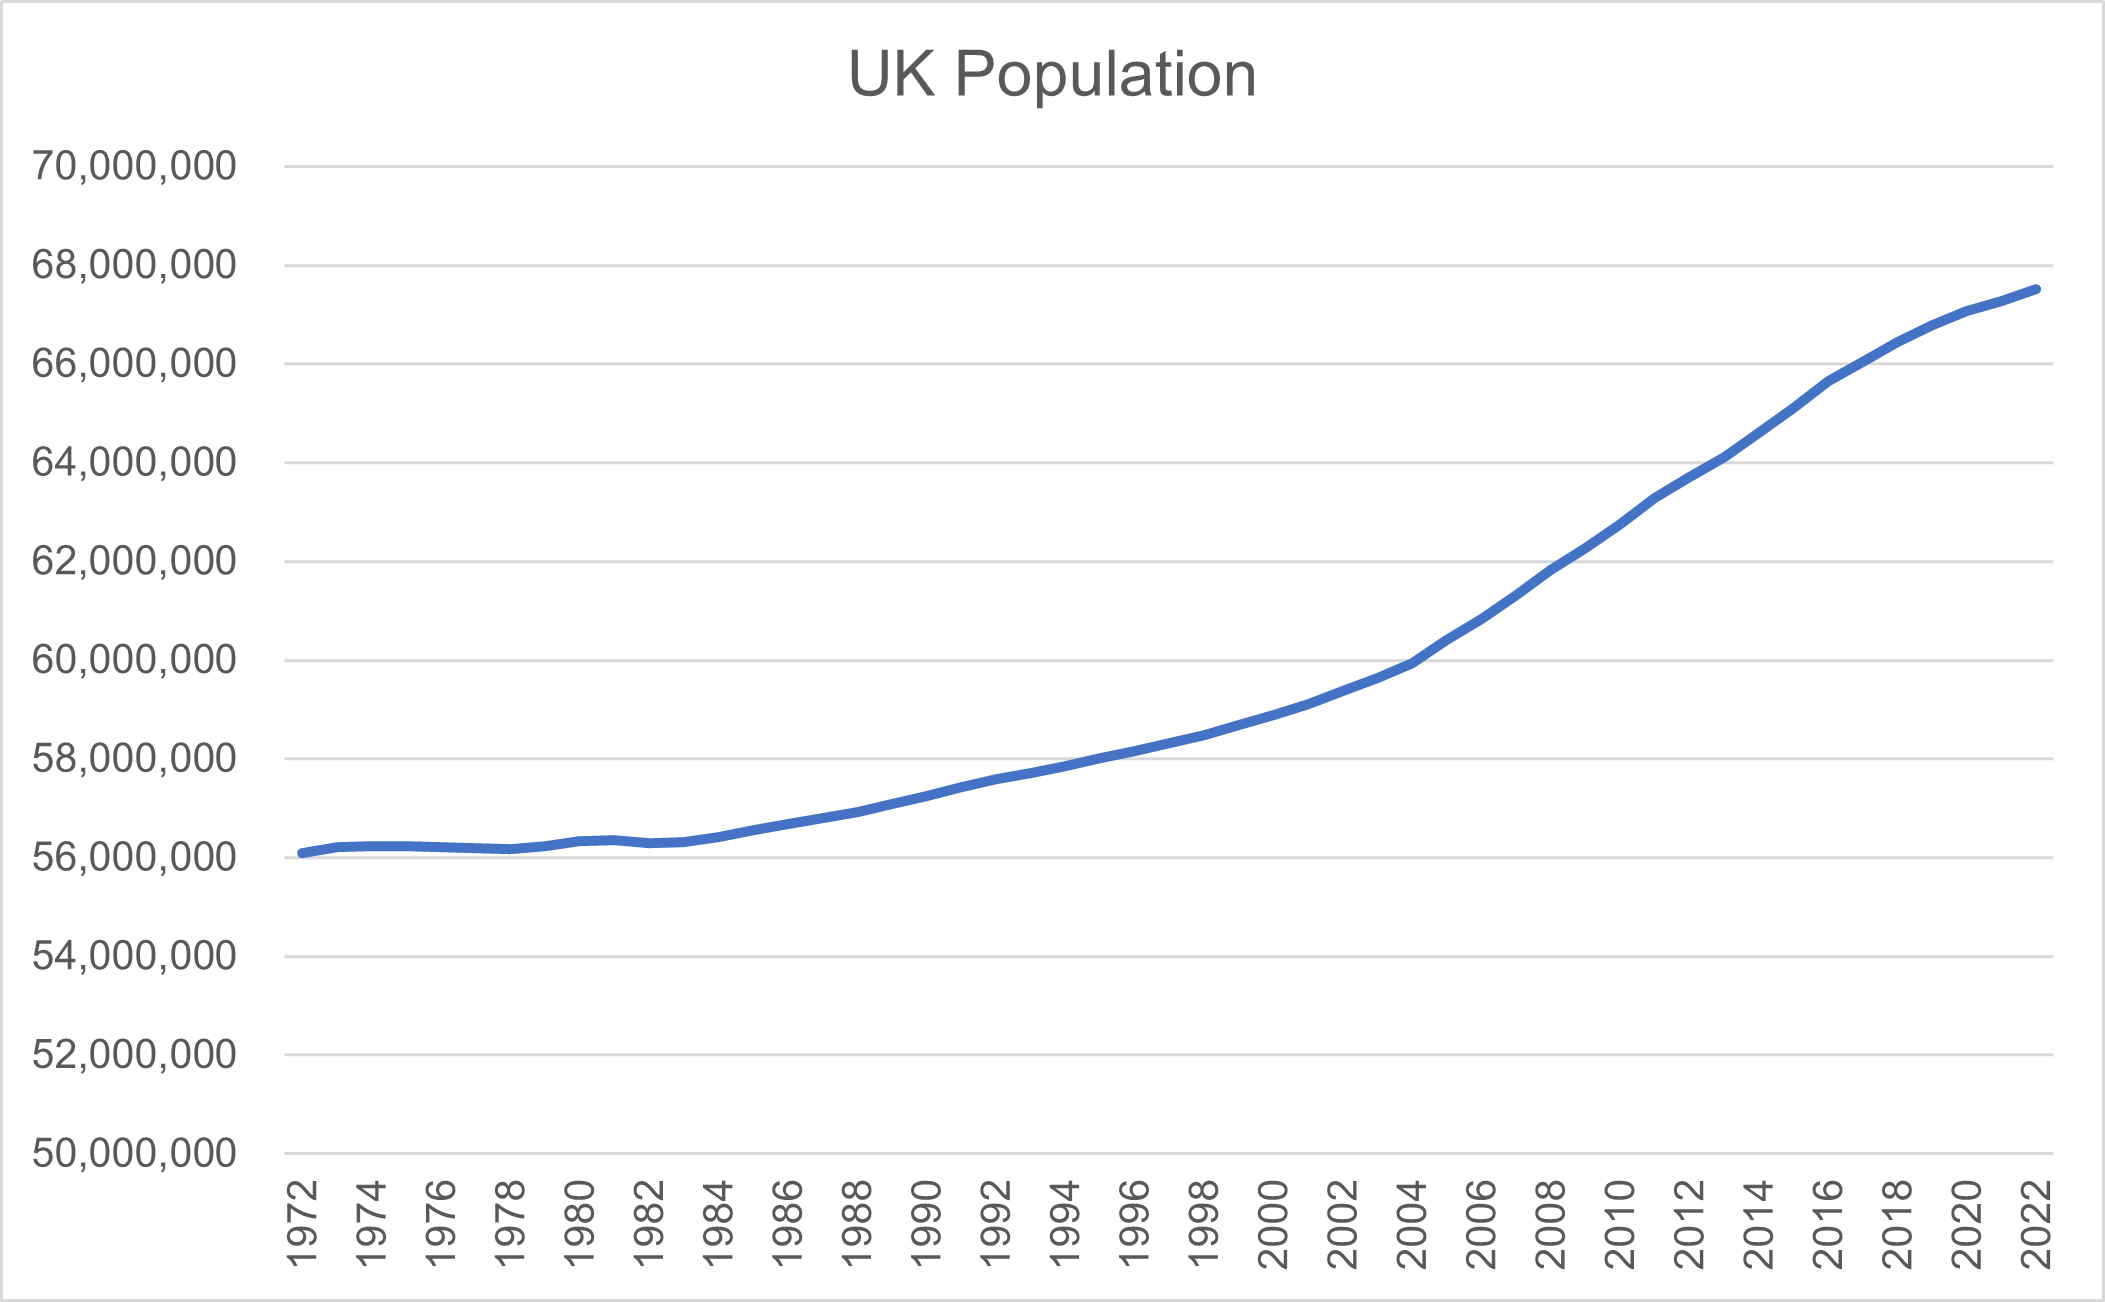
Figure 2: Data source ONS; analysis K Duffy.
Population growth each year is the sum of births minus deaths, known as natural change, plus net migration. The UK’s population growth in the last fifty years has been just over 11 million; natural change and net migration have each contributed just over 5.5 million, though as the following graph shows, in recent decades migration has contributed more to population growth than the natural change from births minus deaths.
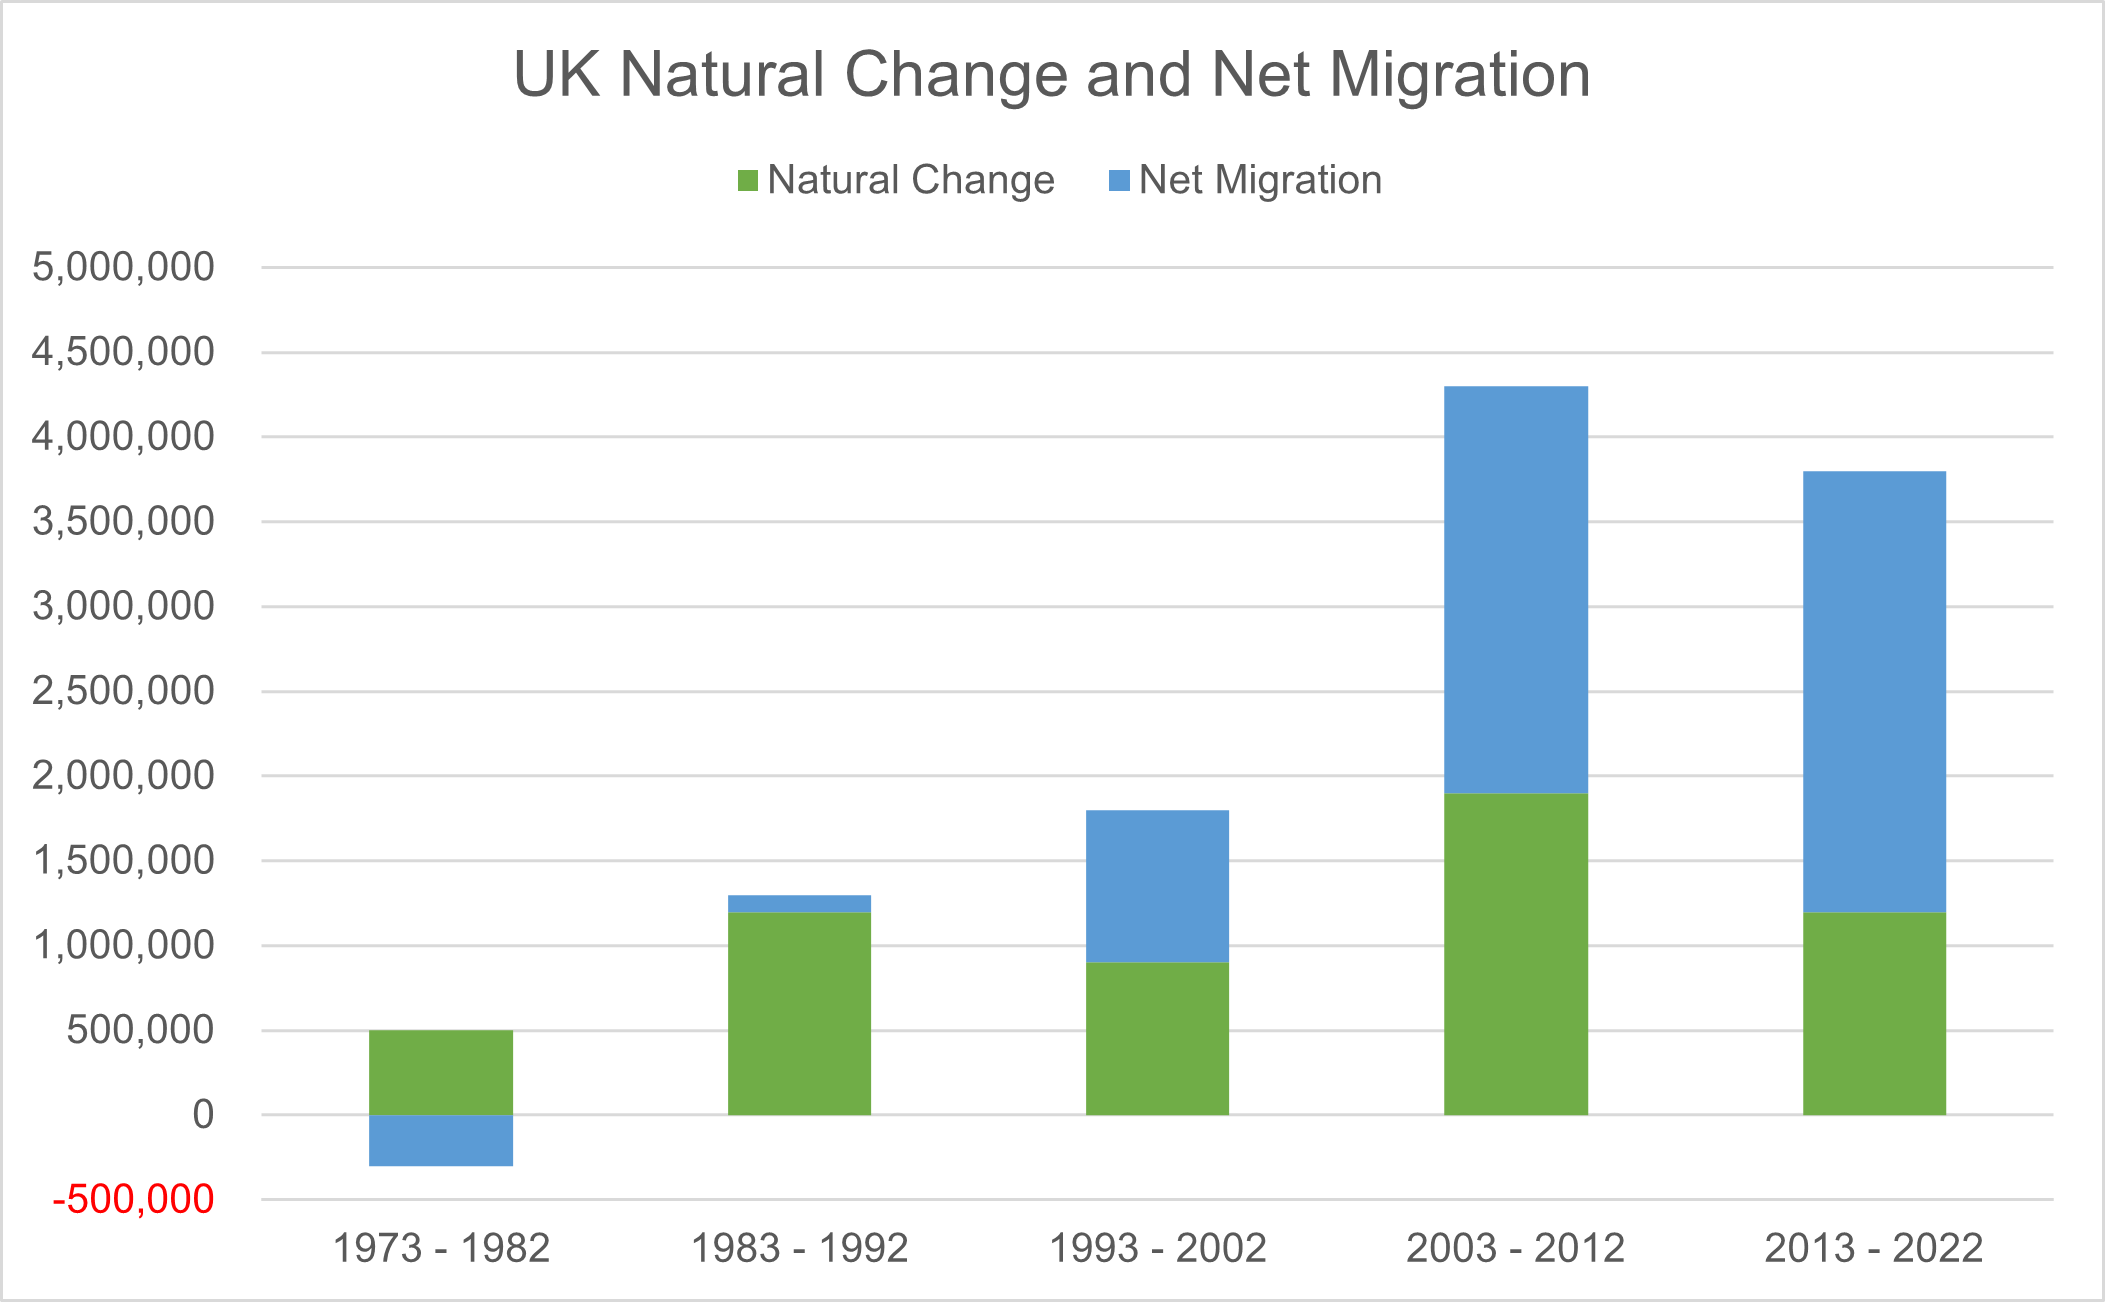
Figure 3: Data source ONS; analysis K Duffy.
Natural change in the UK was greatest in the ten years from 2003 and in the last decade it has fallen back to that of the 1980s. There is a distinct trend over the last ten years of declining births alongside increasing numbers of deaths; in 2020 there were more deaths across the UK than births, for the first time since the mid-1970s.
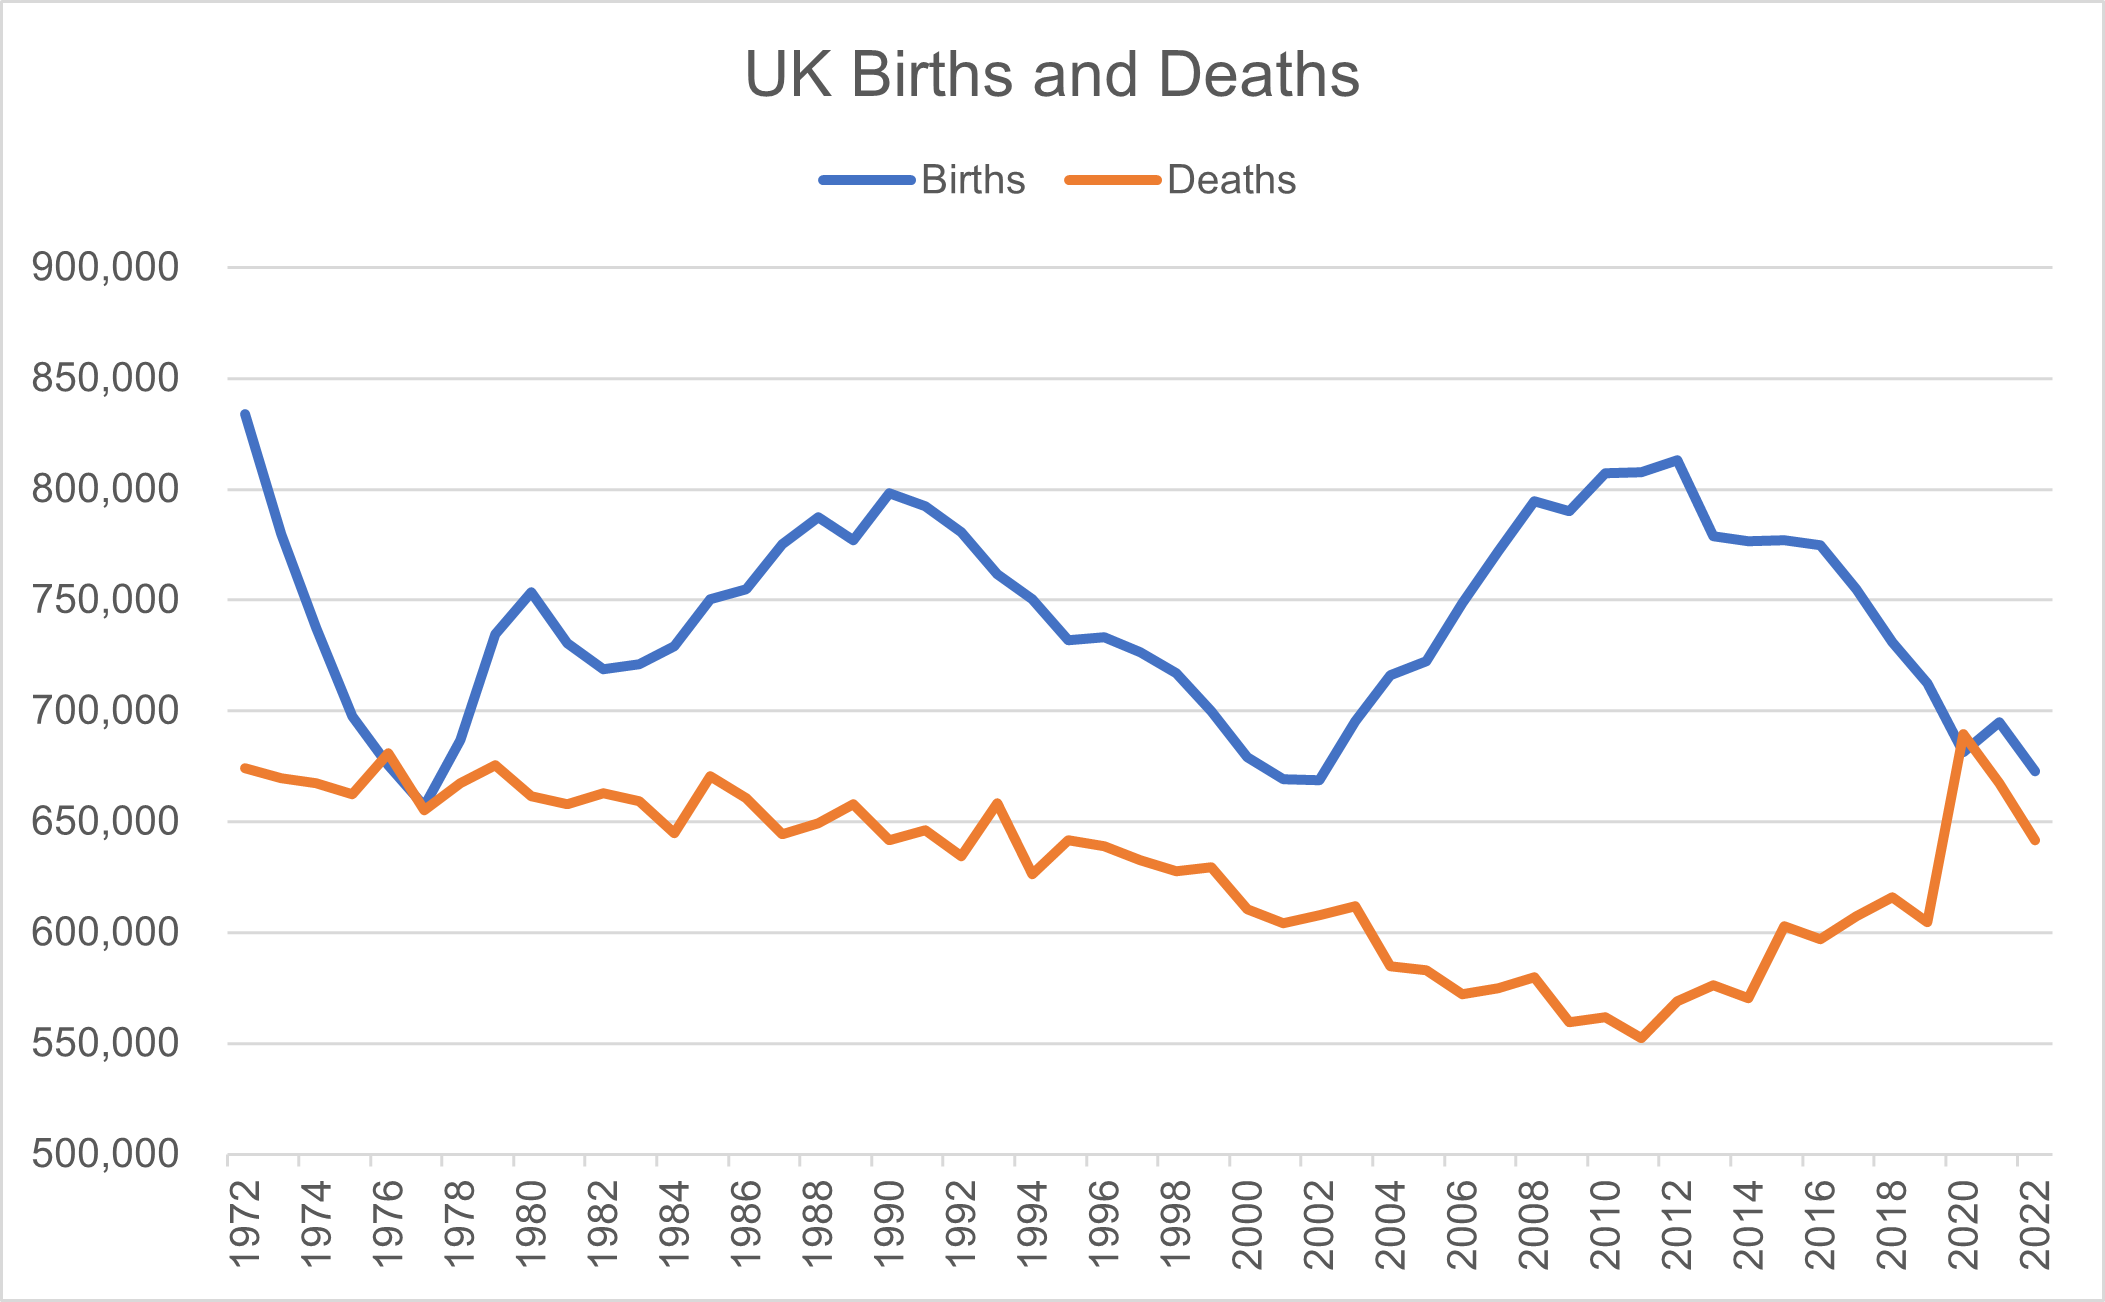
Figure 4: Data source ONS; analysis K Duffy.
Of course, the numbers of births or deaths are each a factor of the overall population number and so it is often helpful to instead refer to the change in the Total Fertility Rate, TFR, which is an indicator of the total average number of children a woman will have during her lifetime. For the UK population total to remain steady, a TFR of 2.08 is required; when it remains below this, then over time, the population will decline unless there is net migration. It may surprise many of us to learn that the UK’s TFR has been below this replacement rate since 1973.
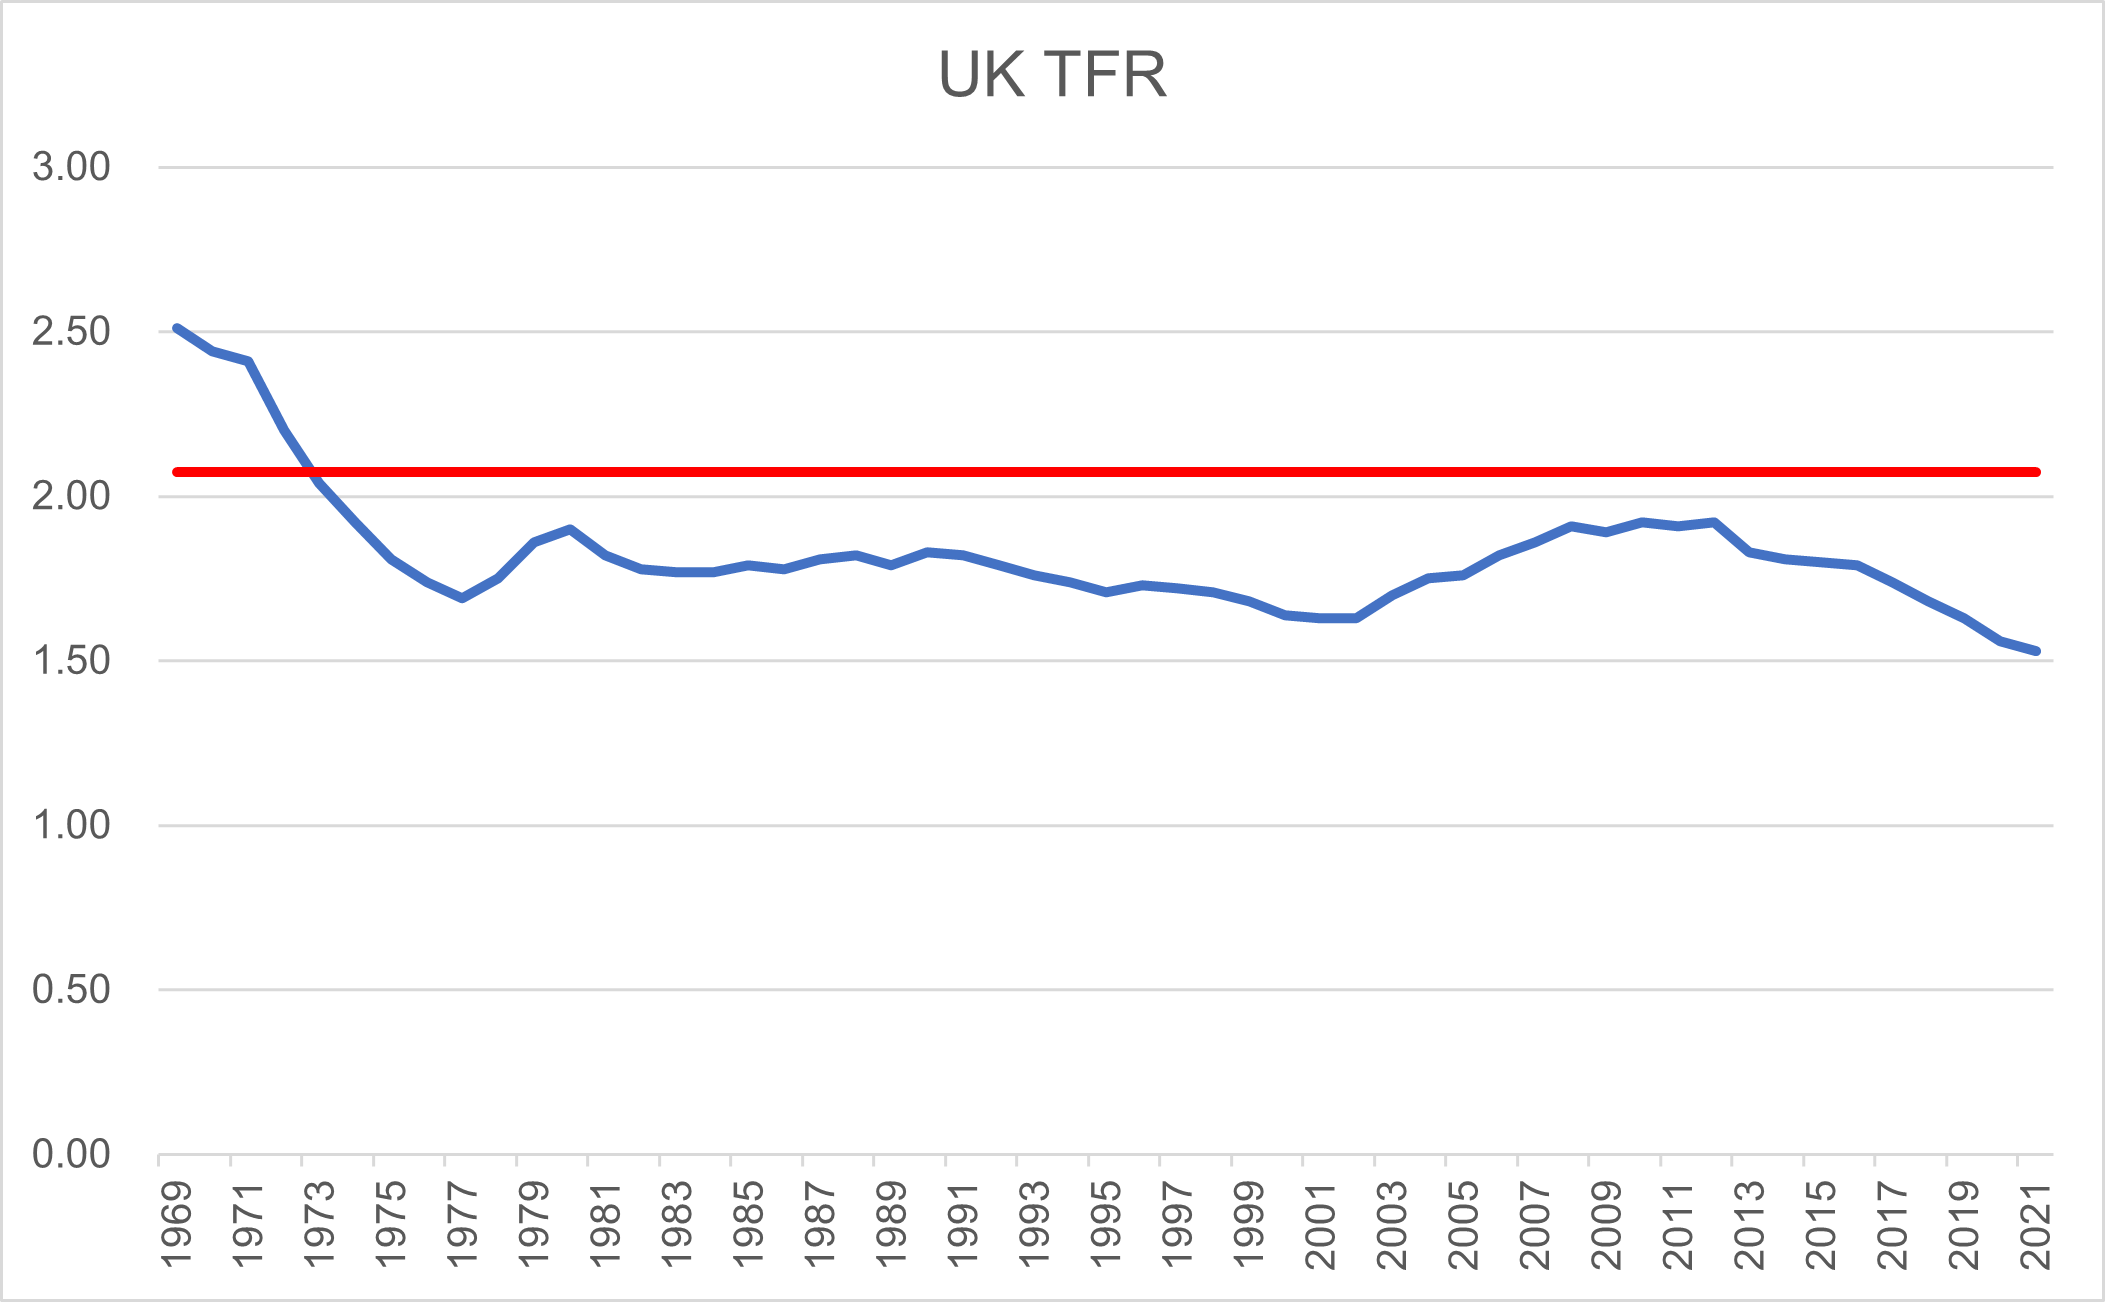
Figure 5: Data source ONS; analysis K Duffy.
The following graph shows the impact of this low TFR on the overall number of births compared to the number needed to naturally replace the population.
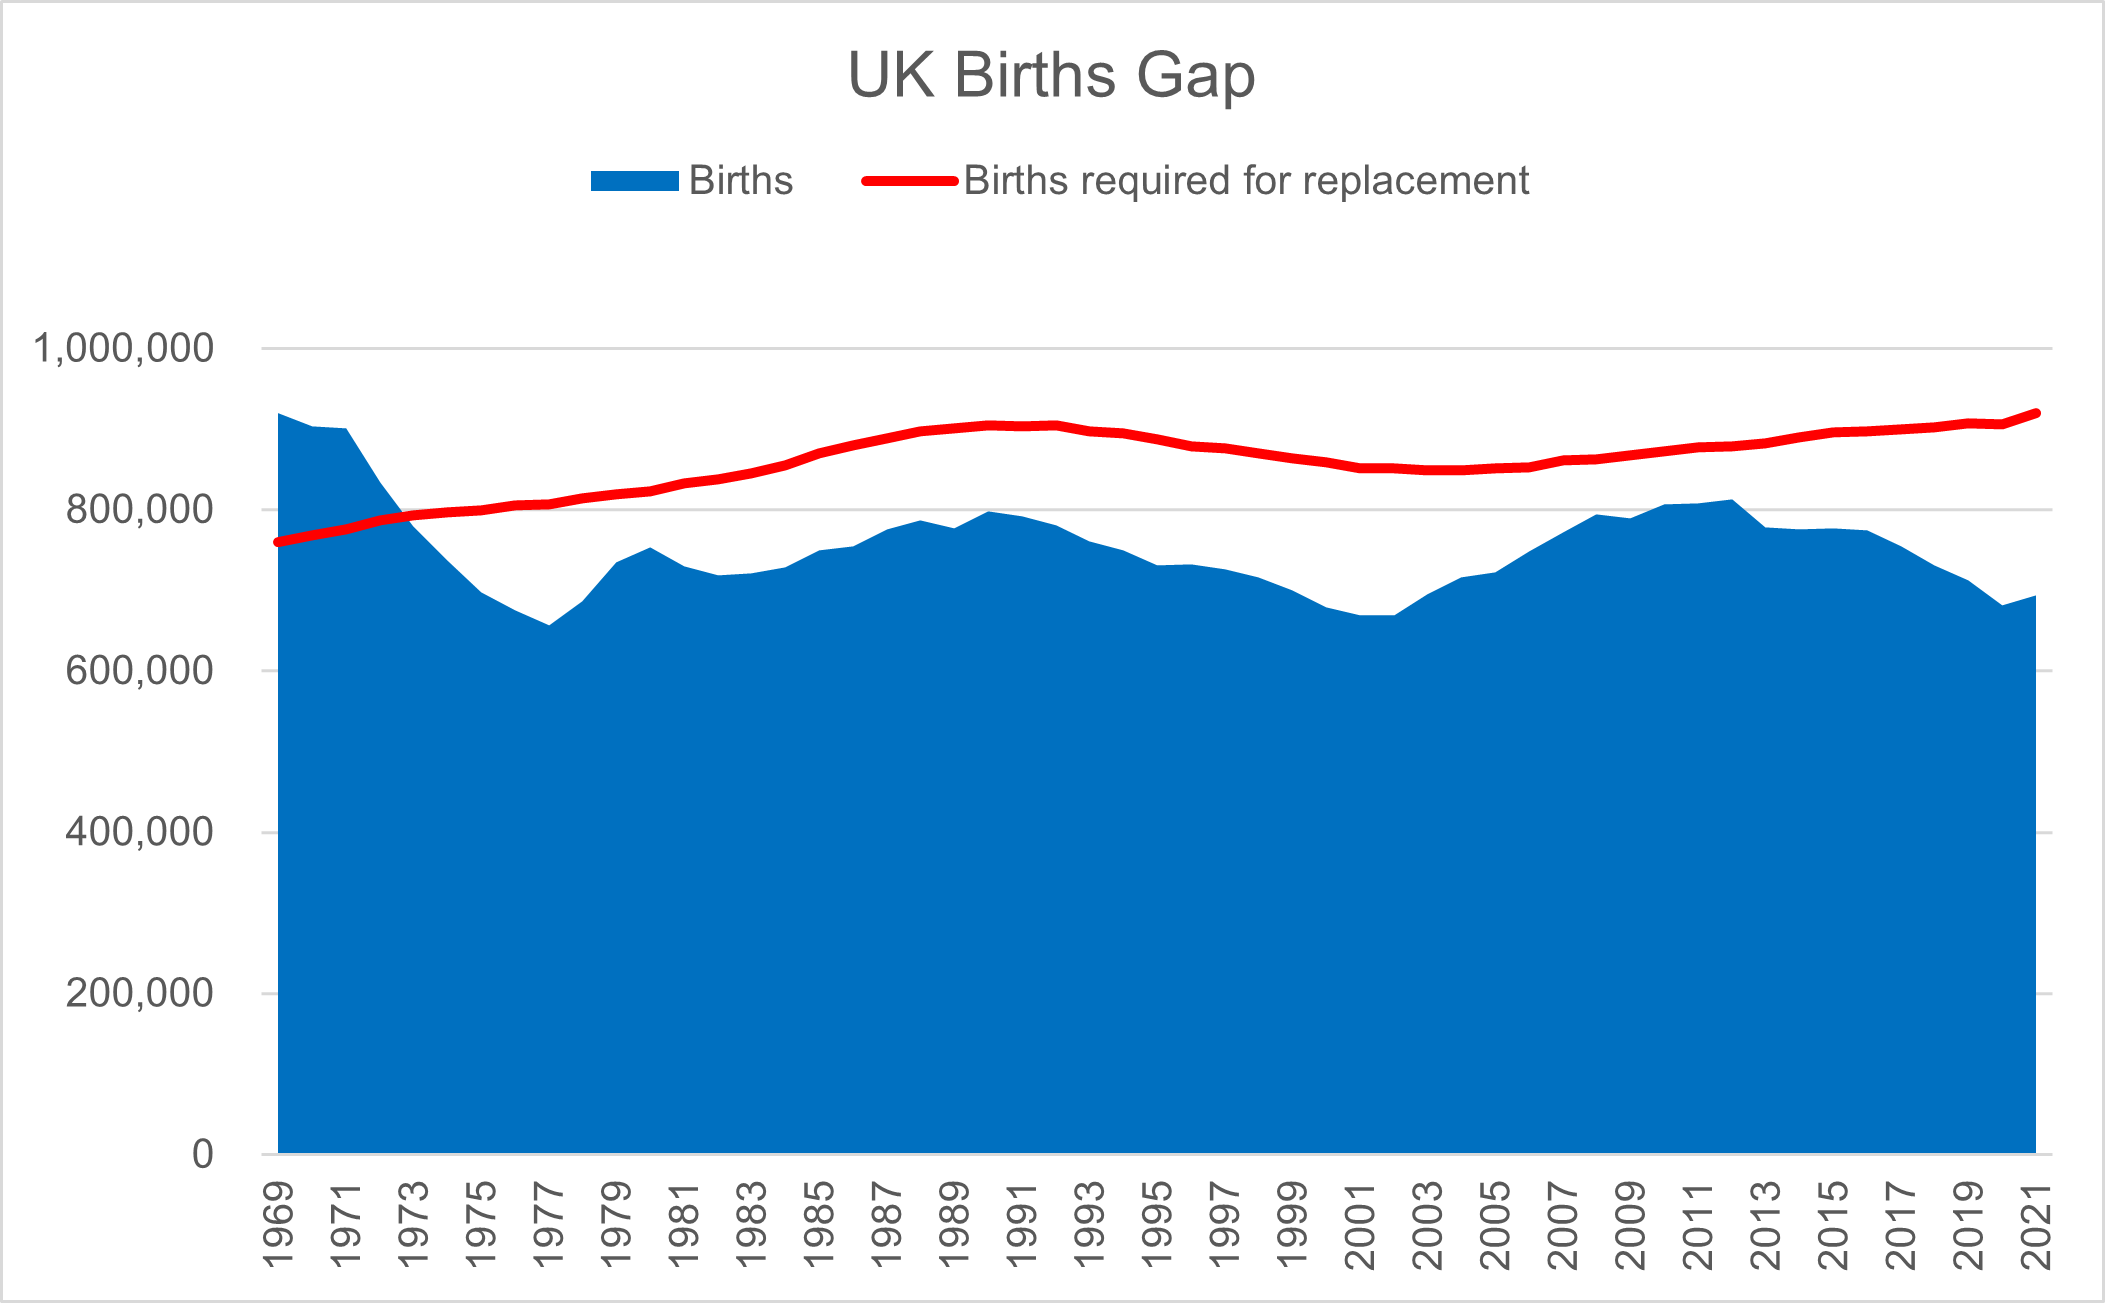
Figure 6: Data source ONS; analysis K Duffy.
There are several ways in which women might have fewer children. These include fertility issues, same-sex relationships, abstinence, use of effective contraception, use of less-effective contraception and being ‘lucky’, infrequent sex and use of emergency contraception afterwards, and abortion when any of the above fails. Let’s consider the trend in abortion over the last fifty years. The following graph shows the annual number of abortions[i], the rate of abortions per 1,000 women aged 15-44 (WRA), and the ratio of abortions to (100) live births.
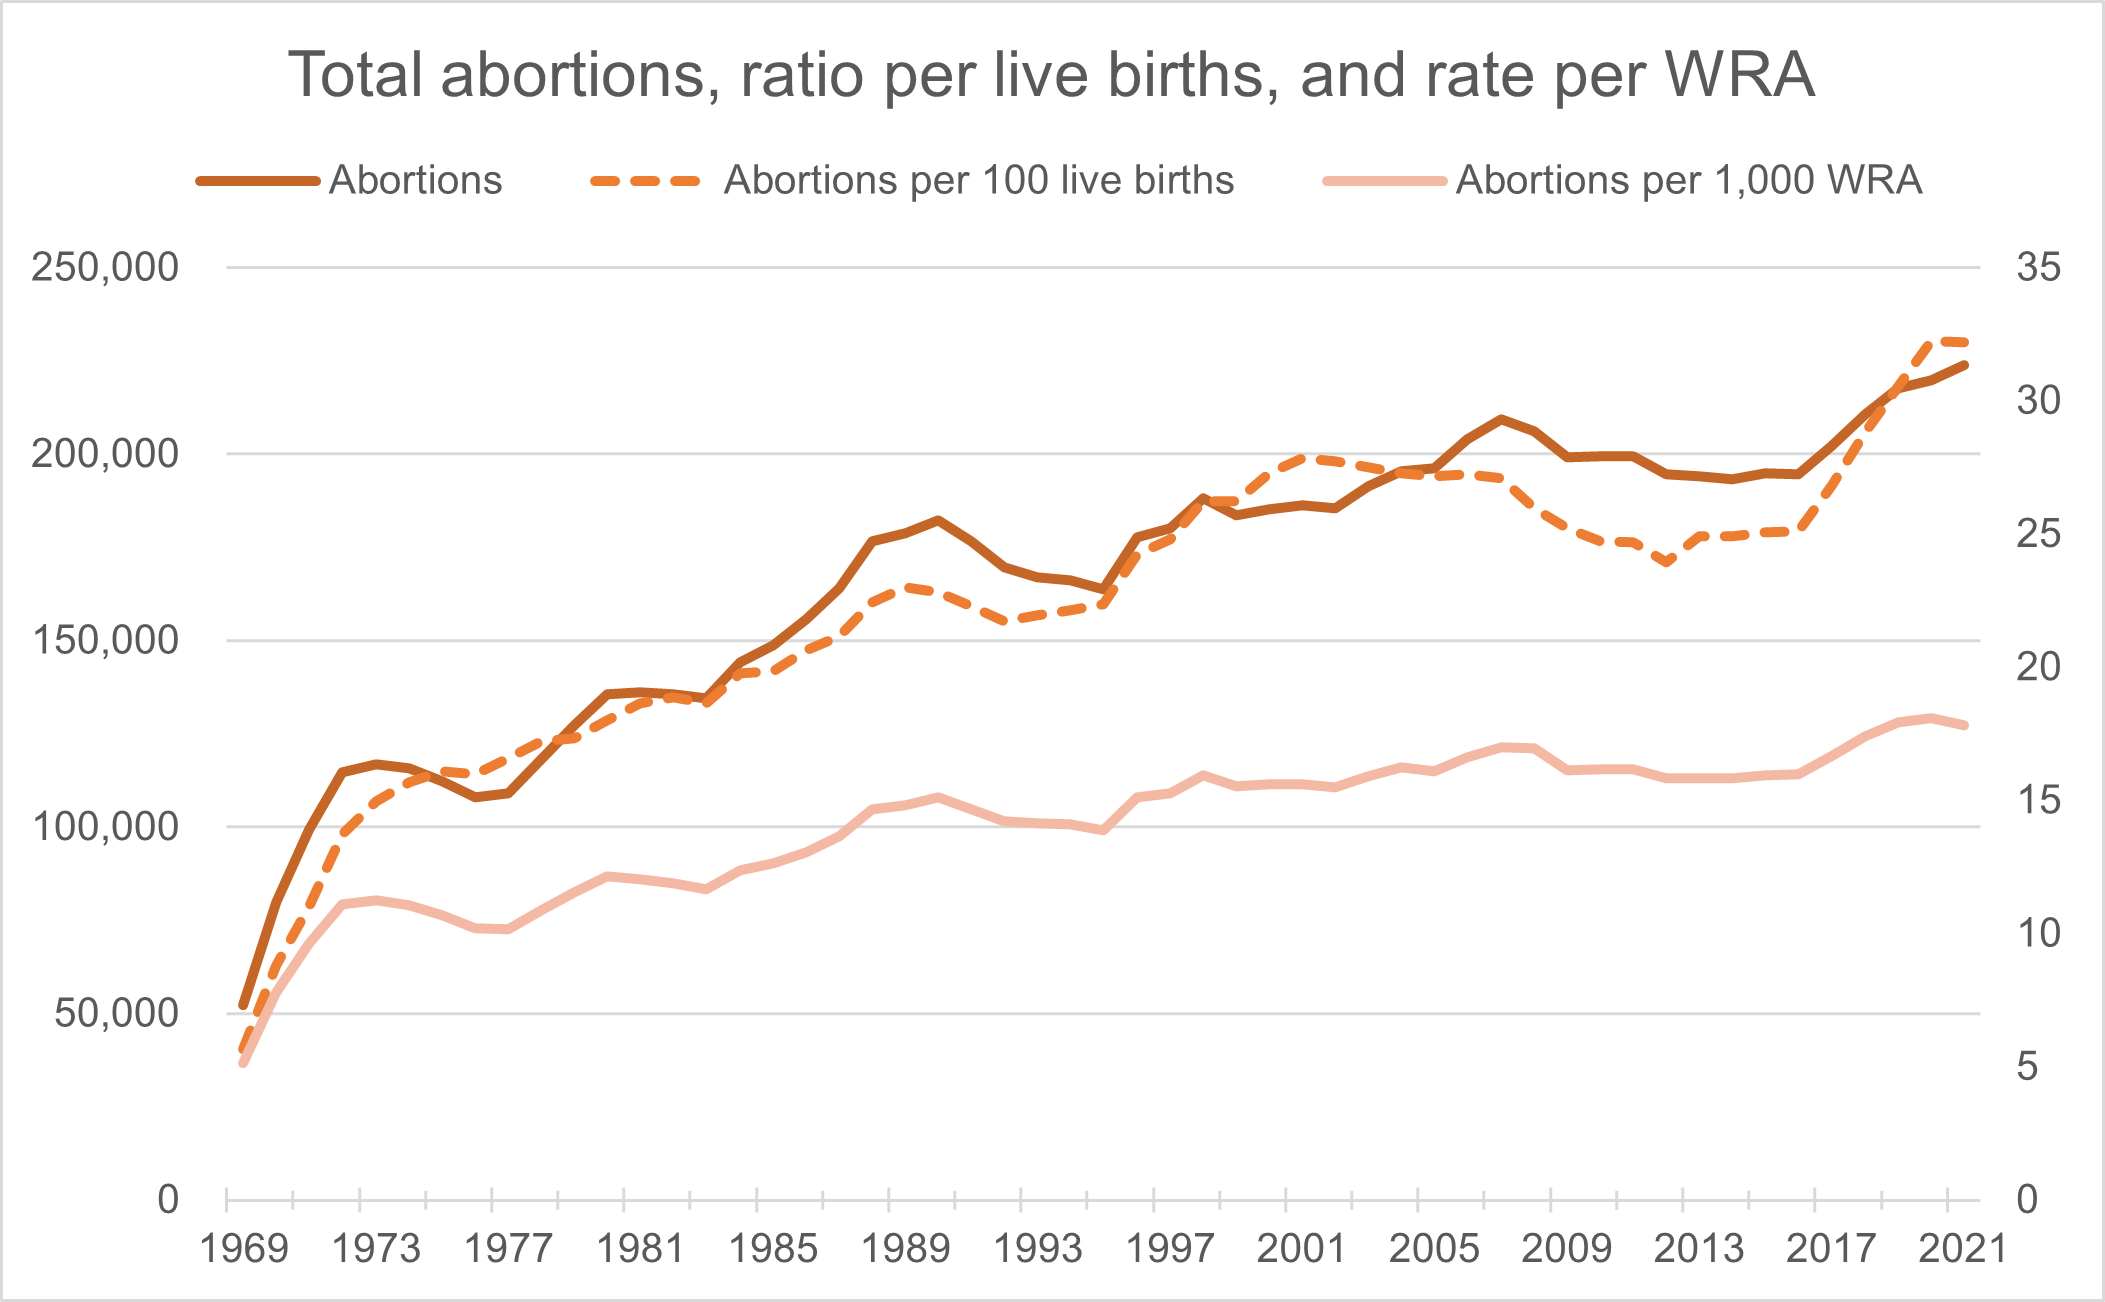
Figure 7: Source data from DHSC for England and Wales, Public Health Scotland, and NI Statistics & Research Agency; analysis K Duffy.
Each of these abortion measures has steadily increased since the passing of the 1967 Abortion Act.
The decline in the UK number of live-births and our overall average total fertility rate is not because women are having less conceptions and pregnancies but because an increasing proportion of those pregnancies are ending in elective abortion. For many years now, the UK has been experiencing a birthed baby shortage. This graph shows that when the annual abortions are added to the annual births, the resulting total is consistently more than that required to meet the replacement rate, a TFR of 2.1+.
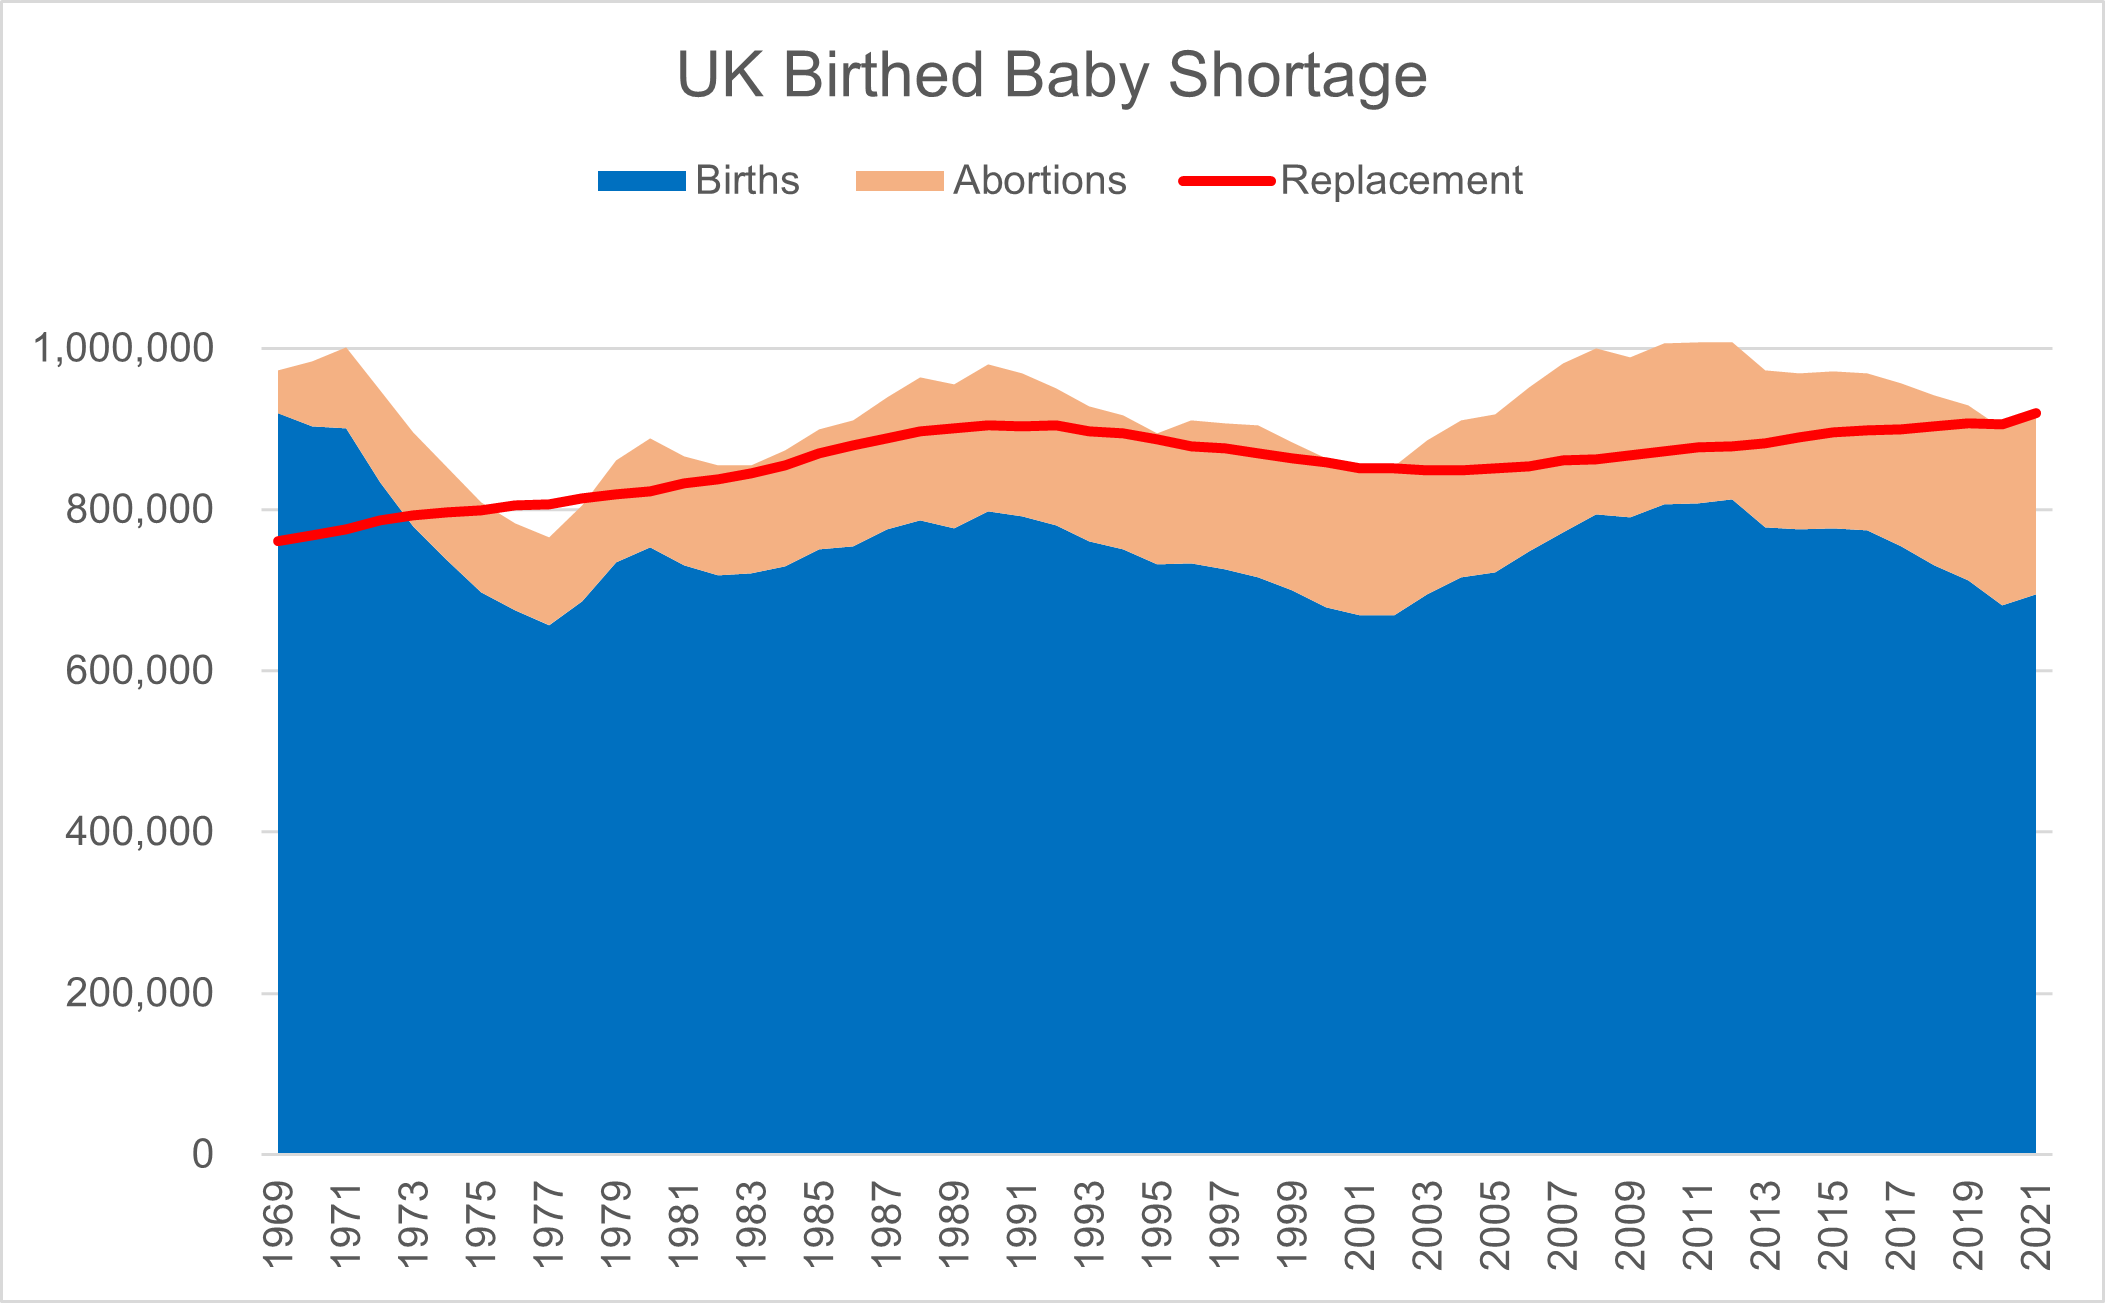
Figure 8: Source data from DHSC for England and Wales, Public Health Scotland, and NI Statistics & Research Agency; analysis K Duffy.
There are those who do not consider this to be an issue, some saying that an increasing UK population is causing undue pressure on our public services, some saying that the average family cannot afford more children, some saying that we need to reduce our impact on the global environment. Notwithstanding the veracity of any of these positions, surely it cannot be right that in the UK, over the last fifty years, abortion has been the major method of population control.
[i] Stated abortion numbers are for Ground C abortions; these are elective, on request of the woman, not because of rape or incest, or any indicated medical risk to the life of the woman, or serious fetal anomalies – Ground C total about 98% of all abortions.